What Is a Knowledge Graph? Why You Need a Personal One
You use knowledge graphs every day without realizing it. When Google shows you a sidebar with facts about a person, place, or concept — that's a knowledge graph. When Netflix recommends movies based on complex relationships between genres, actors, and your viewing history — that's a knowledge graph too.
But what if you could have your own personal knowledge graph?
Knowledge Graphs Explained Simply
A knowledge graph is a way of organizing information as a network of connected entities. Instead of storing data in tables or folders, you store it as:
- Nodes: Things (people, ideas, notes, topics)
- Edges: Relationships between things ("relates to", "is part of", "inspired by")
This structure mirrors how our brains actually work — through associations, not hierarchies.
Why Folders and Tags Aren't Enough
Traditional organization methods have a fundamental flaw: they force you to put things in one place.
A note about "machine learning in healthcare" — does it go in the "Machine Learning" folder or the "Healthcare" folder? With tags, you can add both, but you still can't visualize how it connects to your notes about "data privacy", "neural networks", or "patient outcomes."
The Connection Problem
The real value of knowledge isn't in individual notes — it's in the connections between them. A knowledge graph makes these connections visible and explorable.
How BrainMap Builds Your Personal Knowledge Graph
BrainMap automatically constructs a knowledge graph from your notes:
Node Types
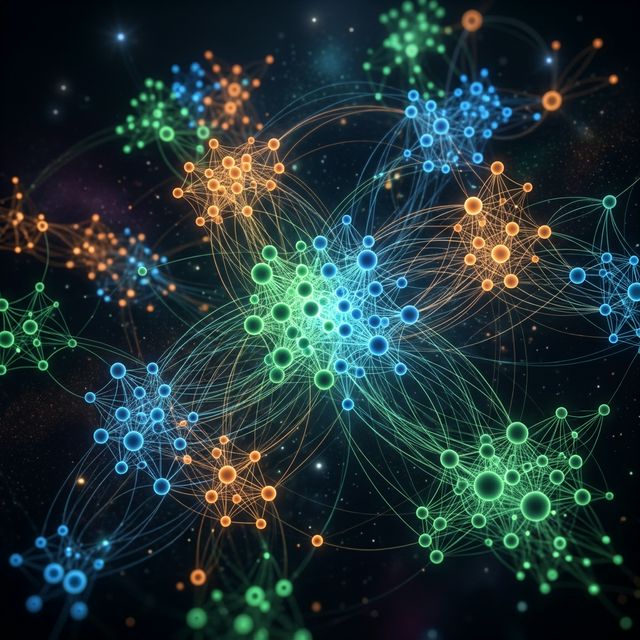
- Notes (green): Your actual content
- Topics (blue): AI-assigned categories like "Machine Learning" or "Product Design"
- Sub-topics (orange): More specific areas like "RAG Pipelines" under "AI"
Edge Types
- Semantic similarity: Notes with related content are connected
- Topic hierarchy: Sub-topics link to parent topics
- AI-discovered relationships: Connections found through analysis
Interactive Exploration
The graph isn't just a static picture. You can:
- Zoom and pan to navigate large knowledge bases
- Filter by topic to focus on specific areas
- Click nodes to read the full note
- View local graphs to see a single note's connections
Real-World Examples
For Researchers
A PhD student studying climate policy might have notes on: carbon taxes, emissions trading, renewable energy subsidies, political economy, and behavioral economics. A knowledge graph would reveal unexpected connections — like how behavioral economics research connects to policy adoption rates.
For Developers
A software engineer learning about system design might take notes on: load balancing, caching, database sharding, CAP theorem, and microservices. The knowledge graph shows how these concepts interconnect, building a mental model faster than linear notes.
For Writers
A blogger writing about productivity might have notes on: time management, deep work, habit formation, and tool reviews. The knowledge graph reveals which topics are well-covered and where gaps exist.
Getting Started with Your Personal Knowledge Graph
Building a personal knowledge graph with BrainMap is effortless:
- Write notes as you normally would
- AI automatically assigns topics and finds connections
- Open the graph to see your knowledge network
- Explore to discover insights you didn't know you had
No manual linking. No complex setup. Just write, and the graph builds itself.
Start building your knowledge graph — free, no credit card required.
Ready to organize your knowledge with AI?
BrainMap automatically classifies your notes, discovers connections, and builds your personal knowledge graph. Free to start — no credit card required.
Start for FreeRelated Articles
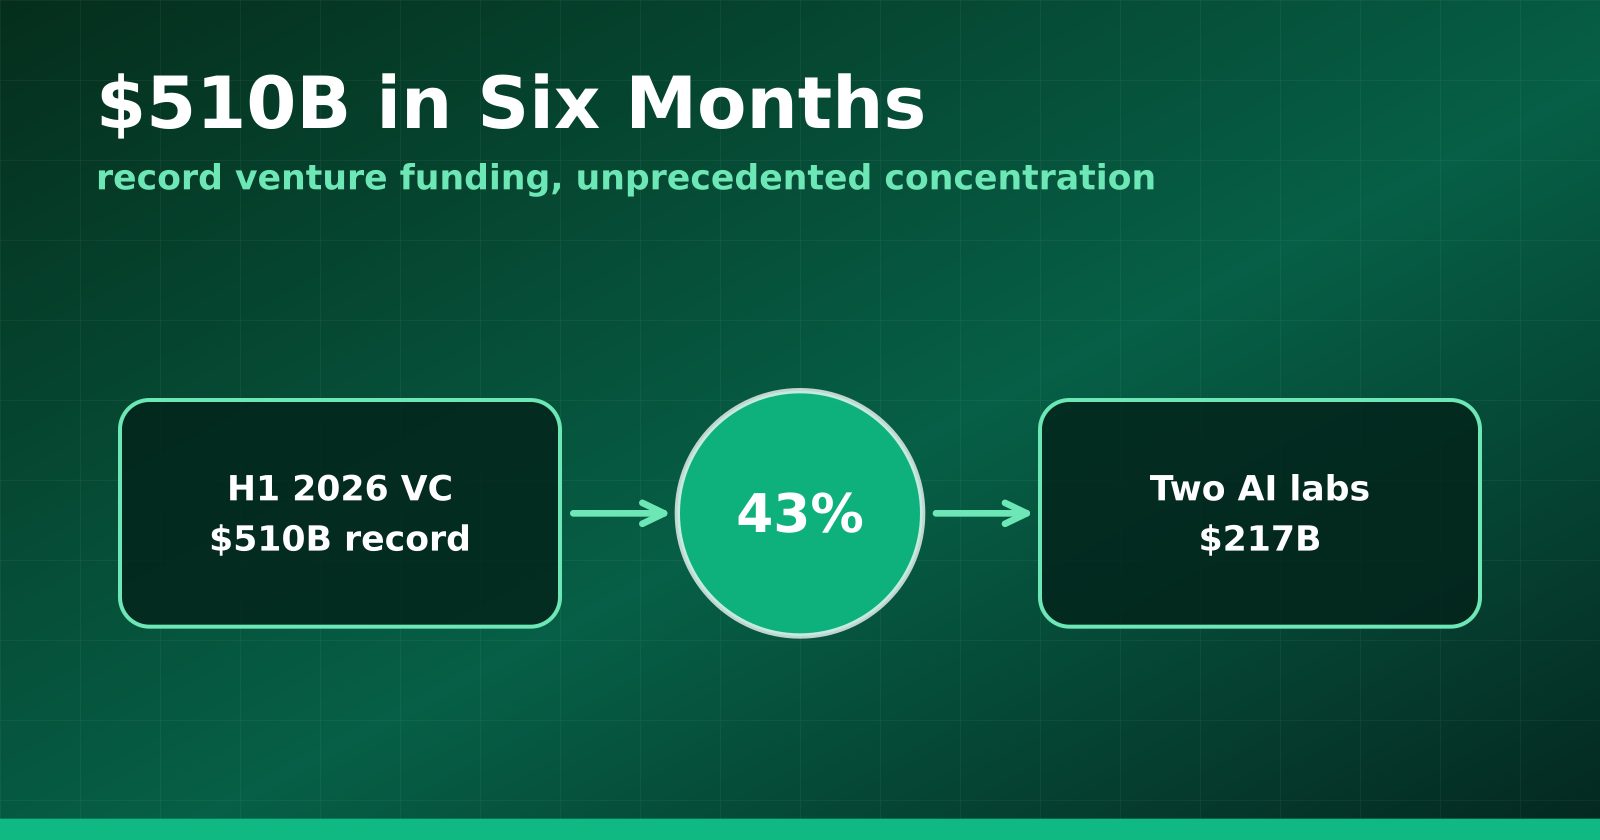
H1 2026 Venture Funding Hit a Record $510B — and Two AI Labs Took 43%
Crunchbase's half-year report shows global VC at an all-time high, with OpenAI and Anthropic alone absorbing $217 billion and AI claiming roughly two-thirds of all deployment.
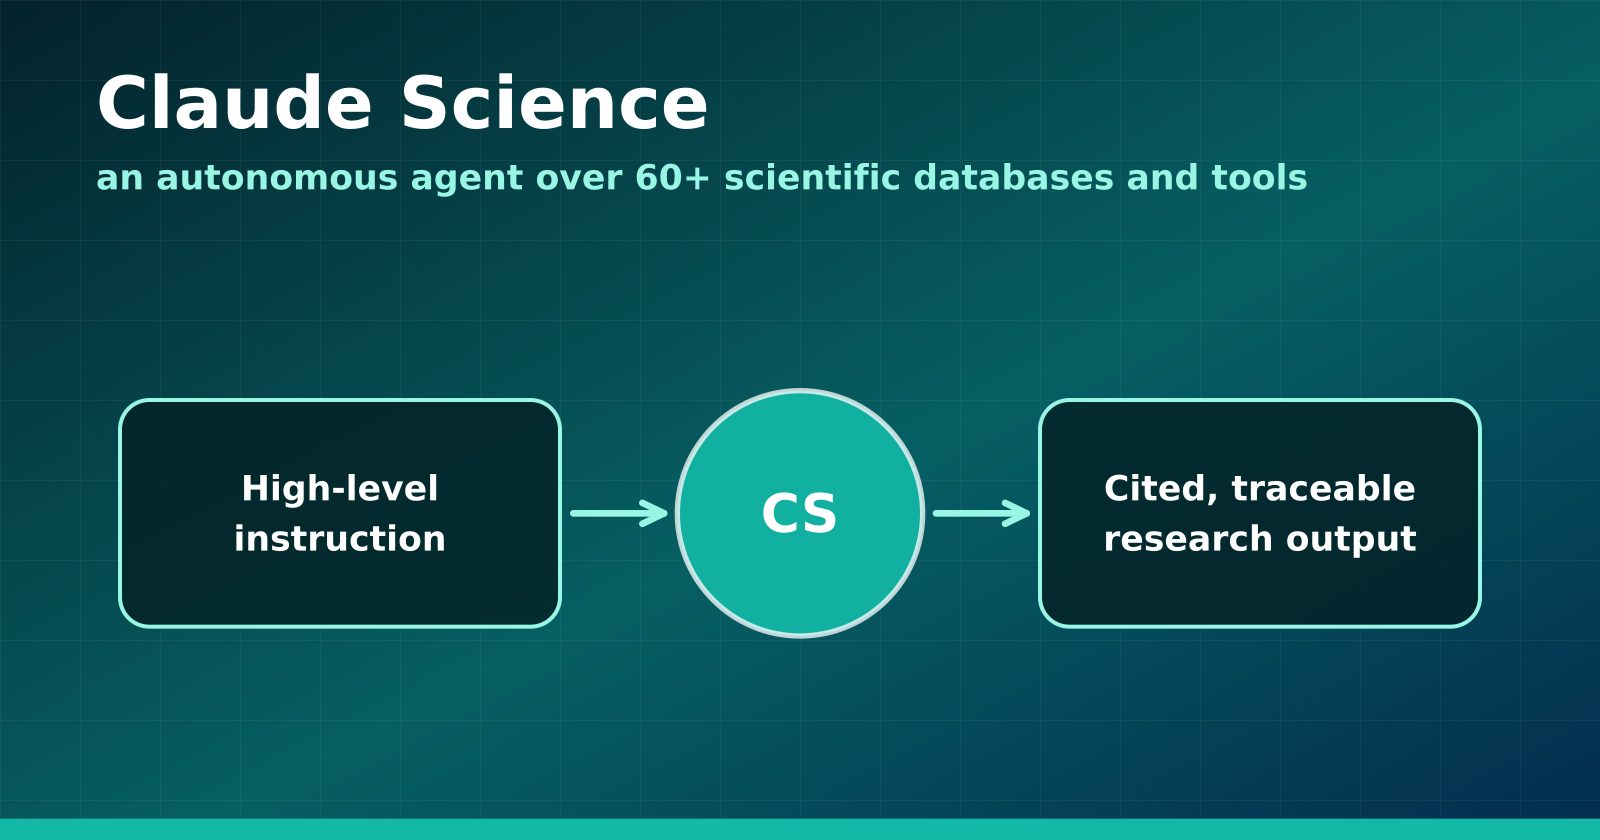
Claude Science Turns the Research Workbench Into an Agent Surface
Anthropic's new flagship product wires 60+ scientific databases and computation tools into an autonomous research agent — and Anthropic is using it to hunt drugs for neglected diseases.
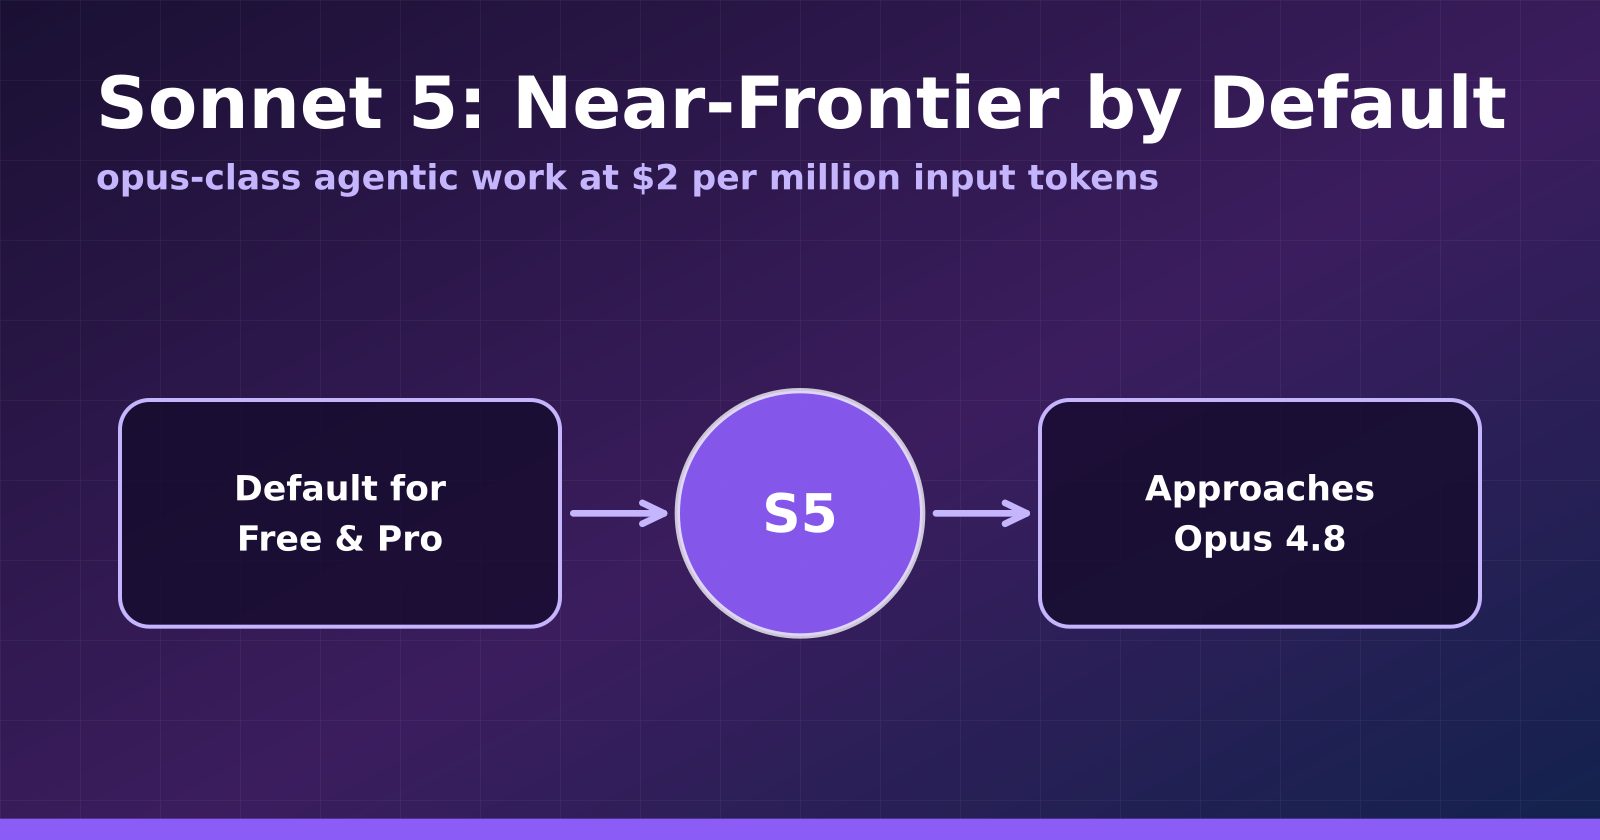
Claude Sonnet 5 Makes Near-Frontier Performance the Default Tier
Anthropic's Sonnet 5 launches at $2 per million input tokens, approaches Opus 4.8 on agentic benchmarks, and becomes the default for Free and Pro users.